
Chart Types and Compatibility
The built-in catalog is defined by PIVOT_CHART_DEFINITIONS. Each definition
owns its stable type ID, family, data view, required semantic channels,
constraints, interactions, presentation capabilities, preview dataset, option
schema, renderer, localized labels, and documentation slug.
The standard dialog evaluates every definition against the current dataset before selection. Compatible recommendations appear first. Incompatible cards stay visible and explain the missing channel or semantic requirement instead of failing after selection.
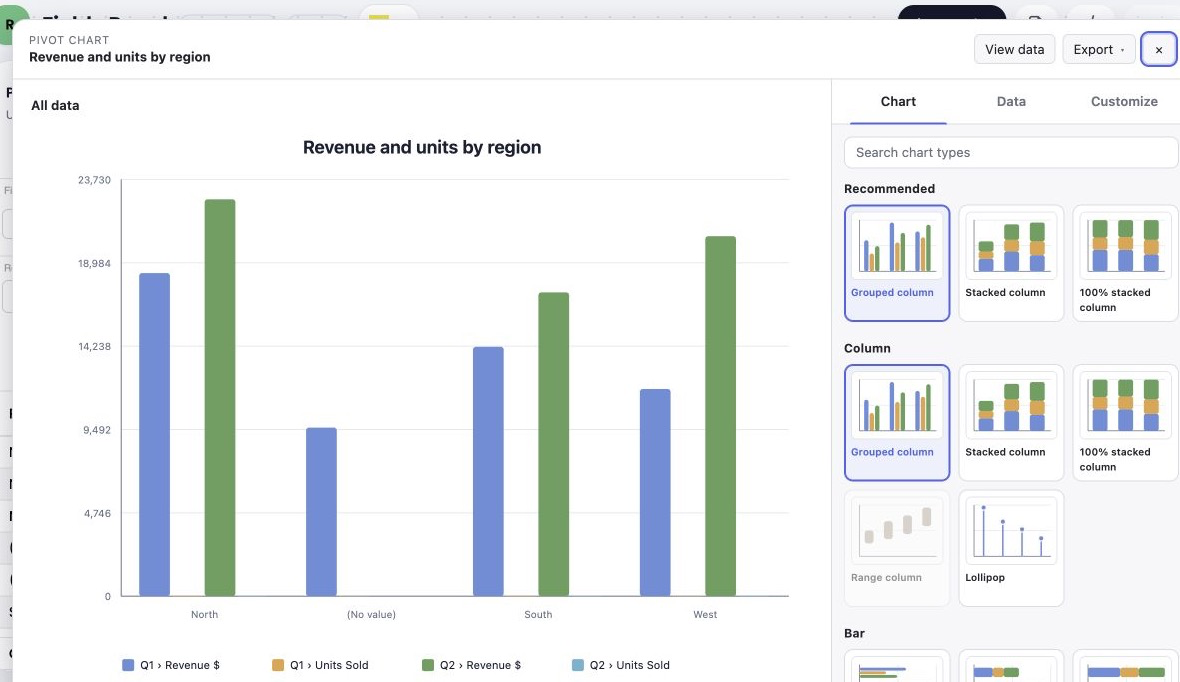
Every gallery card uses the real renderer. Disabled cards explain the missing binding, measure, hierarchy, or derived view.
Gallery behavior
Section titled “Gallery behavior”- Search matches localized type names and descriptions.
- Categories follow the catalog family and order.
- Arrow keys move among cards, while Enter and Space select a compatible type.
- Preview charts are decorative, tooltip-free renderings of catalog fixtures.
- Only near-viewport previews mount; previews are cached by type, renderer, theme, and locale.
- Catalogs larger than 60 entries retain bounded visible-window behavior.
- A chart type is validated again by the headless plugin, so a custom picker cannot bypass compatibility rules.
Comparison charts
Section titled “Comparison charts”| Type | Best for | Required data and constraints |
|---|---|---|
groupedColumn | Comparing multiple series across categories. | Category, value, and one or more series; signed values are supported. |
stackedColumn | Comparing totals and their series contribution. | Category, value, and series; stacks signed values. |
normalizedColumn | Comparing percentage composition across categories. | Category, value, and series; normalizes each category to 100%. |
rangeColumn | Showing vertical low-to-high intervals. | Exactly one low and one high measure per category. |
lollipop | A lighter single-series category ranking. | Category, value, and exactly one selected series. |
groupedBar | Category comparison when labels are long. | Category, value, and series; signed values are supported. |
stackedBar | Horizontal totals with composition. | Category, value, and series. |
normalizedBar | Horizontal percentage composition. | Category, value, and series; normalizes to 100%. |
rangeBar | Horizontal low-to-high intervals. | Exactly one low and one high measure. |
Trend and area charts
Section titled “Trend and area charts”| Type | Best for | Required data and constraints |
|---|---|---|
line | Trends across ordered categories. | Category, value, and series. |
smoothLine | Visually continuous trends. | Same channels as line; smoothing changes geometry, not data. |
steppedLine | State or price changes that hold until the next category. | Category, value, and series. |
smallMultiples | Comparing many trends without overlapping lines. | Category and value with 1–12 series. |
annotatedTimeSeries | Trends with emphasized analytical points. | Category, value, and series; date-like categories are recommended. |
area | Trend magnitude with filled areas. | Category, value, and series. |
steppedArea | Stepwise magnitude changes. | Category, value, and series. |
stackedArea | Total trend plus series contribution. | Category, value, and series. |
normalizedArea | Percentage composition over an ordered axis. | Category, value, and series; normalizes to 100%. |
rangeArea | A low/high band over categories. | Exactly one low and one high measure. |
confidenceBand | An uncertainty envelope around a trend. | Exactly one lower and one upper bound through low and high. |
Part-to-whole charts
Section titled “Part-to-whole charts”All part-to-whole types require non-negative values and select the first available series when more than one series exists.
| Type | Best for | Required data |
|---|---|---|
pie | A small set of category shares. | Category, value, and exactly one series. |
donut | Shares with a central visual summary area. | Category, value, and exactly one series. |
semiDonut | A compact half-ring composition. | Category, value, and exactly one series. |
waffle | Discrete-looking proportions in a 100-cell grid. | Category, value, and exactly one series. |
Relationship charts
Section titled “Relationship charts”| Type | Best for | Required data |
|---|---|---|
scatter | Correlation between two measures. | One x and one y measure with complete paired observations. |
bubble | Correlation with a third magnitude. | One x, one y, and one size measure. |
densityScatter | Dense relationships where individual points overlap. | One x and one y; dense geometry is aggregated for rendering and accessibility. |
connectedScatter | Showing the path or sequence between X/Y observations. | One x and one y; category order defines the connection order. |
The Data panel infers distinct X/Y bindings when possible. A measure already used by one required relationship channel is disabled for the other.
Polar charts
Section titled “Polar charts”Polar charts require non-negative values.
| Type | Best for | Required data |
|---|---|---|
rose | Comparing magnitudes by angle and radius. | Category, value, and series. |
radarLine | Comparing multivariate profiles. | Category, value, and series. |
radarArea | Comparing filled multivariate profiles. | Category, value, and series. |
polarColumn | Radial category comparison. | Category, value, and series. |
stackedPolarColumn | Radial totals and composition. | Category, value, and series. |
normalizedPolarColumn | Radial percentage composition. | Category, value, and series. |
radialBar | A single-series circular progress comparison. | Category, value, and exactly one series. |
multiRingRadialBar | Comparing several series as concentric rings. | Category, value, and series. |
Distribution and statistical charts
Section titled “Distribution and statistical charts”| Type | Best for | Required data |
|---|---|---|
histogram | Frequency distribution across numeric bins. | Category/value input and one series; the analytical frame supplies or derives bins. |
stripDot | Showing individual observations along a value axis. | Category/value input and one series. |
boxPlot | Median, quartiles, spread, and outliers. | A derived distribution or quantile view for one series. |
violin | Distribution shape and density. | A derived distribution or quantile view for one series. |
errorInterval | Actual values with lower and upper error bounds. | One actual, one low, and one high measure. |
rangeInterval | Comparing two or three interval-related series. | Category and value with 2–3 series. |
Hierarchy charts
Section titled “Hierarchy charts”Hierarchy charts require row-hierarchy metadata and select one weight series. Treemap and sunburst additionally require non-negative weights.
| Type | Best for | Required data |
|---|---|---|
treemap | Space-efficient nested proportions. | hierarchy plus one weight measure. |
sunburst | Concentric hierarchy levels. | hierarchy plus one weight measure. |
icicle | Depth-oriented rectangular hierarchy. | hierarchy plus one weight measure. |
circlePacking | Nested hierarchy represented by packed circles. | hierarchy plus one weight measure. |
Matrix and specialized charts
Section titled “Matrix and specialized charts”| Type | Best for | Required data |
|---|---|---|
heatmap | Comparing magnitude across category-by-series cells. | Category, value, and series. |
calendarHeatmap | Activity intensity by date. | A date-semantic category, value, and exactly one series. |
waterfall | Sequential positive and negative contribution to a result. | Category, value, and exactly one series. |
timelineRange | Start/end intervals by category. | Exactly one start and one end measure. |
Process, flow, and financial charts
Section titled “Process, flow, and financial charts”| Type | Best for | Required data |
|---|---|---|
funnel | Stage-by-stage conversion or attrition. | Non-negative category/value data and one series. |
pyramid | Hierarchical-looking stage magnitude. | Non-negative category/value data and one series. |
sankey | Weighted directional flows. | source, target, and non-negative weight channels. |
chord | Weighted relationships in a circular flow matrix. | source, target, and non-negative weight channels. |
candlestick | Open/high/low/close price movement. | Exactly four series bound to open, high, low, and close. |
ohlc | Compact open/high/low/close price ticks. | Exactly four OHLC series. |
volumePrice | OHLC price movement plus traded volume. | Exactly five series: OHLC plus volume. |
Combination and KPI charts
Section titled “Combination and KPI charts”| Type | Best for | Required data |
|---|---|---|
columnLine | Comparing measures that benefit from column and line geometry. | Category/value data with at least two series. |
areaLine | Comparing a filled magnitude with a trend. | Category/value data with at least two series. |
bullet | Actual versus target in a compact linear view. | One actual and one target measure. |
gauge | Actual versus target on a dial. | One actual and one target measure. |
kpi | A headline value with target and optional variance. | One actual, one target, and optionally one variance measure. |
progressGauge | Progress toward a target. | One actual and one target measure. |
Compatibility rules
Section titled “Compatibility rules”evaluatePivotChartCatalog and evaluatePivotChartCompatibility return
compatible, inferred, or incompatible results with structured reasons.
Compatibility checks cover:
- renderer support for the requested type;
- minimum and maximum channel counts;
- distinct required bindings such as X and Y or low and high;
- non-negative value constraints;
- hierarchy and semantic date requirements;
- derived distribution, range, flow, financial, and geographic views;
- safe category, series, and point limits.
When a compatible relationship chart is missing explicit bindings, the catalog may return an inferred binding patch. Persisted models still retain the resolved explicit bindings.
Optional geographic pack
Section titled “Optional geographic pack”createPivotChartGeographicCapabilityPack(provider) creates a standalone host
for provider-owned choropleth, proportionalSymbolMap, and
geographicHeatmap views. Render these explicitly with pack.render(...).
They are intentionally outside PIVOT_CHART_TYPES and the standard gallery.
The provider owns map assets, projected geometry, and licensing; Pivot
does not bundle a map library or geographic data.
Previous: Pivot Charts overview · Next: Data and bindings · API reference