
Customization and Export
Pivot Charts separate portable model presentation from renderer-wide styling.
Use presentation and chartOptions when the choice must persist with one
chart. Configure createPivotChartsRenderer when an application needs a
shared palette, typography, tooltip, or export pipeline.
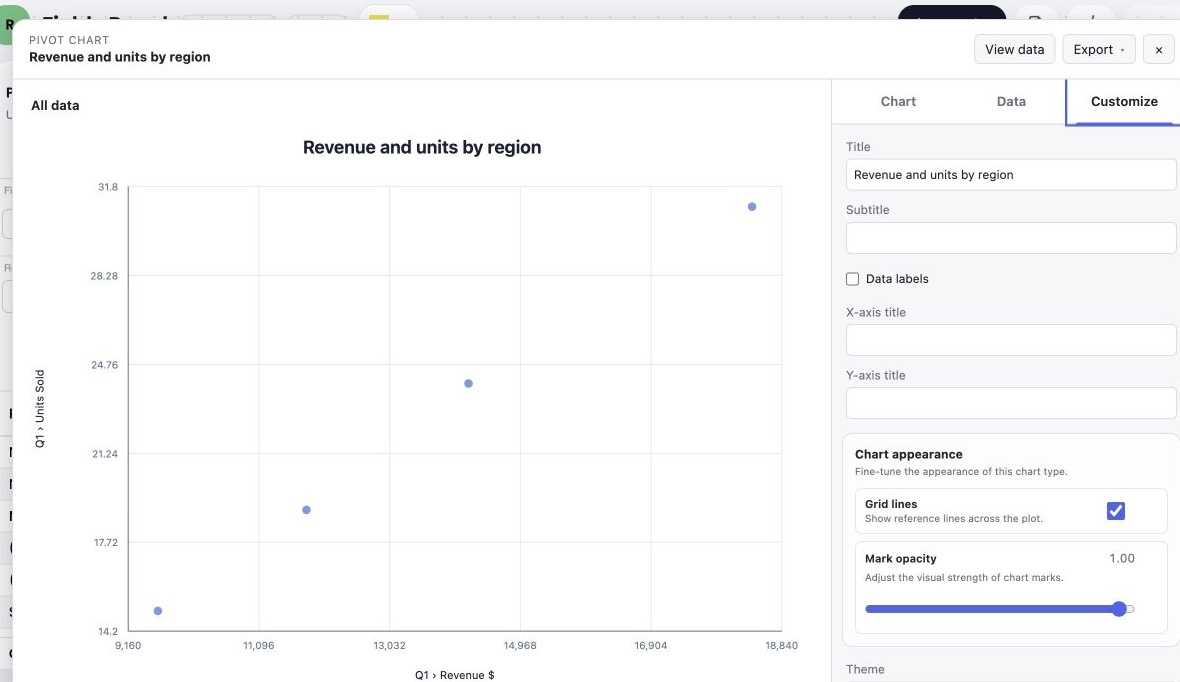
The Customize tab combines portable presentation fields with the catalog-defined options supported by the selected chart.
Portable presentation
Section titled “Portable presentation”await chart.update({ presentation: { title: 'Quarterly sales', subtitle: 'Committed orders only', legendPosition: 'bottom', dataLabels: true, xAxisTitle: 'Region', yAxisTitle: 'Revenue', }, theme: 'material',});legendPosition accepts top, right, bottom, left, or none.
theme accepts auto or a renderer-supported theme string. The standard UI
offers follow-grid, default, material, compact, dark material, and dark compact
choices.
Chart-specific options
Section titled “Chart-specific options”The catalog generates a typed option schema for every chart:
| Option | Availability | Valid values |
|---|---|---|
showGridLines | Charts with axes. | Boolean. |
markOpacity | Every built-in type. | 0.2–1 in 0.05 steps. |
strokeWidth | Line, area, combination, radar line, and radar area. | 1–6 in 0.5 steps. |
fillOpacity | Area-family, area-line, radar area, confidence band, and range area. | 0.1–0.9 in 0.05 steps. |
await chart.update({ chartOptions: { showGridLines: false, markOpacity: 0.9, strokeWidth: 2.5, },});Unsupported keys, out-of-range values, and values that do not align with the declared step are rejected during update and restore.
Renderer styling
Section titled “Renderer styling”const renderer = createPivotChartsRenderer({ className: 'sales-chart', fontFamily: '"IBM Plex Sans", sans-serif', categorySeparator: ' / ', palette: ['#2563eb', '#f97316', '#16a34a'], theme: ({ theme }) => ({ ...theme, background: '#fffdf8', foreground: '#292524', grid: '#e7e5e4', }),});The theme callback receives the resolved light/dark base theme and current render input. Renderer classes, theme colors, palette, fonts, labels, and visible chart options are retained in image and document exports.
Semantic label pipeline
Section titled “Semantic label pipeline”Every visible label passes through one formatter. Kinds are title,
subtitle, axisTitle, axisTick, category, legend, data,
annotation, summary, and specialized.
const renderer = createPivotChartsRenderer({ labels: { styles: { title: { fontSize: 20, fontWeight: 700 }, category: { fill: '#475569', fontSize: 11 }, data: { fontWeight: 600 }, }, formatter(context) { if (context.kind === 'legend') { return `Measure: ${context.defaultText}`; } if (context.kind === 'axisTick' && context.axis === 'y') { return null; } if (context.kind === 'data' && context.formattedValue) { return { text: context.formattedValue, ariaLabel: `${context.category?.label}: ${context.formattedValue}`, className: 'sales-chart-value', }; } return undefined; }, },});Return a string, a structured result, null to suppress one label, or
undefined to retain the default. Structured results can override text,
accessible text, classes, safe SVG typography, opacity, and visibility.
Tooltip customization
Section titled “Tooltip customization”const renderer = createPivotChartsRenderer({ tooltip: { showDelayMs: 100, hideDelayMs: 60, followPointer: true, className: 'sales-chart-tooltip', formatter(context, defaultContent) { return { ...defaultContent, footer: context.drillable ? 'Open the next sales level' : 'Leaf value', }; }, },});The formatter receives raw and formatted values, category and series metadata,
relationship channels, mark color, and drillability. Return structured
content, plain text, an HTMLElement, or null to suppress one tooltip. Set
tooltip: false to disable tooltips.
Full localization
Section titled “Full localization”pivotCharts.localeText supports deep partial overrides for dialog actions,
status and errors, breadcrumbs, gallery tabs/families, all chart names and
descriptions, compatibility reasons, chart options, data controls and table,
legend overflow, tooltips, accessibility text, context actions, themes,
totals, and number formatting.
grid.pivotCharts = { renderer: createPivotChartsRenderer(), localeText: { actions: { exportChart: 'Exportar', downloadPdf: 'Transferir PDF', viewData: 'Ver dados', viewChart: 'Ver gráfico', }, chartTypes: { groupedColumn: 'Colunas agrupadas', boxPlot: 'Diagrama de caixa', }, renderer: { formatNumber: (value) => new Intl.NumberFormat('pt-PT').format(value), }, },};PNG, PDF, and image data
Section titled “PNG, PDF, and image data”The built-in renderer advertises PNG and PDF through
capabilities.downloadFormats. The dialog’s Export menu downloads the
current rendered chart. Programmatic downloads default to PNG:
await charts.downloadChart(chart.id, { fileName: 'quarterly-sales', fileFormat: 'pdf', width: 1_600, height: 900,});
const dataUrl = await charts.getChartImageDataURL(chart.id, { width: 1_200, height: 675,});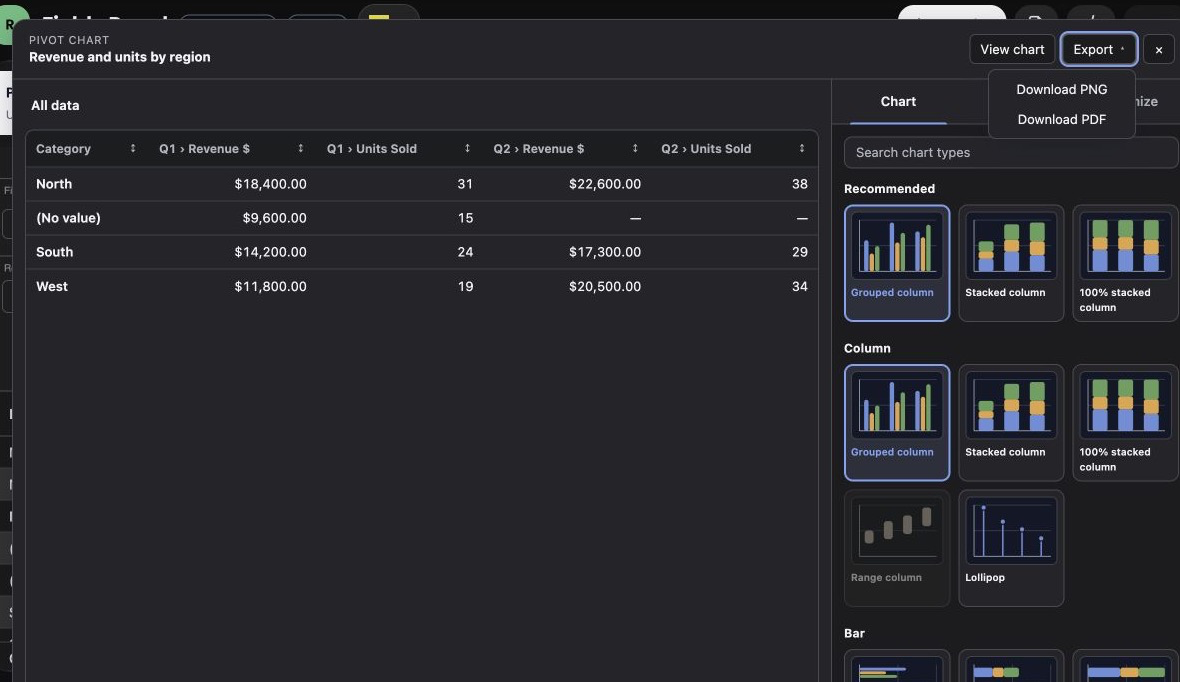
Data view and export operate on the current drill frame. Exported graphics keep the resolved theme and semantic formatting.
Custom renderers should advertise only the formats they implement. The
first-party renderer also accepts imageEncoder and pdfEncoder callbacks
for applications that need a different rasterization or PDF pipeline.
Previous: Drill-down and interactions · Next: Headless API and persistence · API reference