
Drill-down and Interactions
Pivot Charts carry row and column hierarchy metadata into every compatible dataset. A mark can therefore identify the exact semantic category, series, paths, measure, aggregator, and child state that produced it.
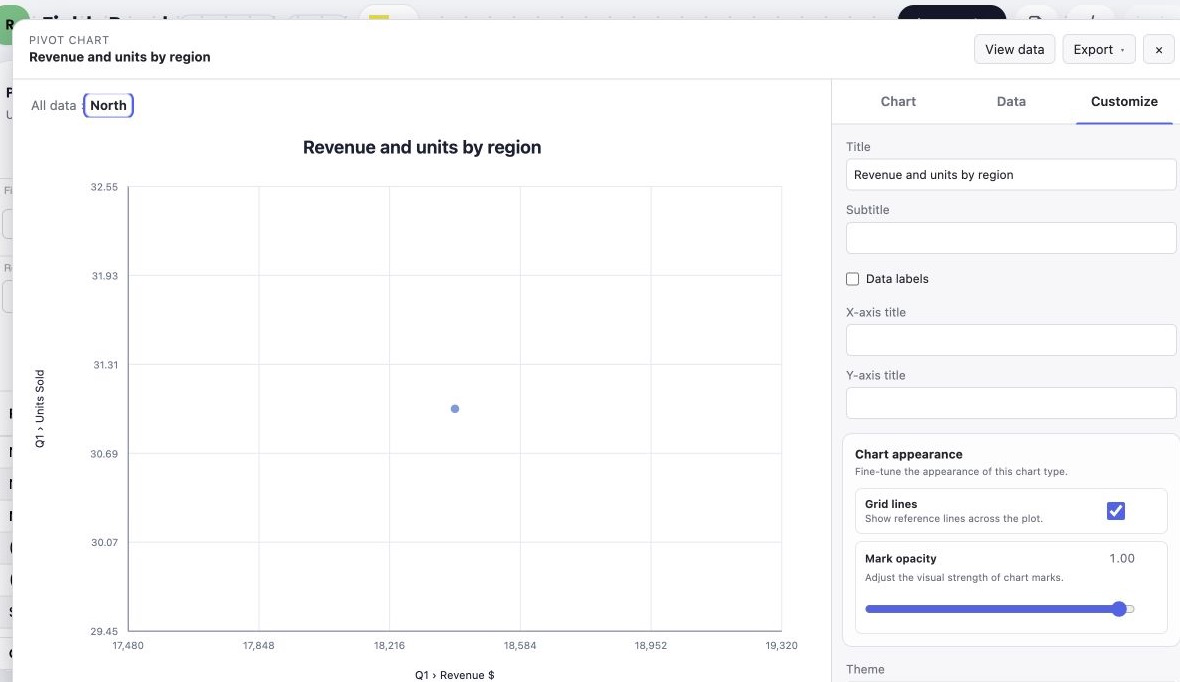
The breadcrumb is the navigation surface for the current row and column scope. Tooltips expose the full path, formatted value, and drill hint.
Cell-aware creation
Section titled “Cell-aware creation”With pivotChartsUi.contextMenu: true and ContextMenuPlugin installed,
right-clicking a Pivot analytical body cell contributes Pivot Chart….
Creation resolves scope from committed Pivot metadata:
- group values open their immediate children;
- leaf values open siblings under the same parent;
- subtotal and grand-total cells use the nearest valid breakdown;
- the clicked column member and measure seed the series selection;
- values-on-rows retain the clicked category measure.
The context action composes with other menu contributions. It does not replace application items or depend on visible DOM text.
Mark activation
Section titled “Mark activation”Pointer click and keyboard activation first look for an automatic semantic
drill target. When the category or series can drill, activation starts the
appropriate row, column, or two-axis drill action and does not emit
pivot-chart-node-click. The event is emitted only when no automatic drill
target exists.
The chart ref supports row, column, and two-axis targets:
if (chart.canDrillDown({ axis: 'row', category })) { await chart.drillDown({ axis: 'row', category });}
await chart.drillDown({ axis: 'column', series });await chart.drillDown({ axis: 'both', category, series });Use canDrillDown before offering an application-owned drill control. It
checks hierarchy identity, level, child state, and the current active scope.
Breadcrumb navigation
Section titled “Breadcrumb navigation”Each successful frame is stored in PivotChartDrillState.frames. The compact
breadcrumb shows the active row and column labels:
await chart.drillUp();await chart.drillTo(1);await chart.resetDrill();Selecting All data resets to the root. Selecting an ancestor calls
drillTo directly; it does not replay every intermediate click. After a
successful UI drill, focus moves to the current breadcrumb item.
Loading, cancellation, and retry
Section titled “Loading, cancellation, and retry”Drill loads are abortable and revision-checked:
- the last successful frame stays visible while the next frame loads;
- a newer action aborts or supersedes older work;
- stale provider completions are ignored;
- rendering failures roll back model and dataset state;
- successful scopes are cached;
- failed drill metadata is retained for
retryDrill().
The dialog displays the pending target, failure message, and retry action without discarding the previous chart.
Drill synchronization
Section titled “Drill synchronization”drillSyncMode controls the relationship between chart navigation and the
Pivot frontier:
| Mode | Behavior |
|---|---|
chart | Navigate only in the chart. |
pivot | Synchronize the Pivot frontier and let the linked Pivot refresh drive the chart. |
both | Commit the chart frame and synchronize the Pivot. |
event | Emit pivot-chart-drill-sync; the application owns synchronization. |
For pivot and both, the active PivotPlugin applies the semantic frontier
unless pivotCharts.synchronizeDrill is provided. The custom adapter receives
the event detail and an AbortSignal.
grid.pivotCharts = { renderer: createPivotChartsRenderer(), defaultDrillSyncMode: 'event', async synchronizeDrill(detail, { signal }) { await saveAnalyticsRoute(detail.to, { signal }); },};Legend focus and selection
Section titled “Legend focus and selection”Series legends are keyboard-accessible guides, not drill controls. Activating a legend item focuses that series, emphasizes matching marks, and mutes the others. Activating it again or selecting the chart background clears the focus. When a dense legend cannot fit, it shows a deterministic subset and a localized hidden-series count.
Semantic tooltips
Section titled “Semantic tooltips”Interactive marks use an application-owned tooltip card rather than native SVG
title text. The default tooltip includes:
- the complete category path;
- series identity and formatted value;
- the resolved mark color;
- X, Y, and size rows for relationship charts;
- a drill hint when the datum has children.
Pointer tooltips stay inside the viewport. Keyboard focus opens the same card
immediately and connects it with aria-describedby. Escape closes
the tooltip without closing the chart dialog. Gallery previews intentionally
do not create tooltips.
Keyboard and accessibility
Section titled “Keyboard and accessibility”- The modeless dialog has a stable accessible name and restores focus when it closes.
- Gallery tabs, cards, breadcrumbs, legend items, chart marks, export actions, and the data table are keyboard operable.
- Marks have localized accessible names built from category, series, formatted value, relationship channels, and drillability.
- The data table uses headers, a caption, row headers, and sort announcements.
- Status regions announce loading, drill success, failure, and data-table sort changes without replacing visible content.
Drill and interaction events
Section titled “Drill and interaction events”| Event | Purpose |
|---|---|
pivot-chart-node-click | Reports the activated semantic datum and its paths/measure when no automatic drill target exists. |
pivot-chart-before-drill | Cancelable event before a drill is committed. |
pivot-chart-drill-start | Announces a pending drill frame. |
pivot-chart-drilled | Supplies the committed model and dataset. |
pivot-chart-drill-error | Reports the failed transition and error. |
pivot-chart-drill-reset | Reports a successful reset to root. |
pivot-chart-drill-sync | Delegates pivot, both, or event synchronization. |
Event payloads clone JSON-safe semantic state. See Headless API and persistence for the full lifecycle event list.
Previous: Data and bindings · Next: Customization and export · API reference