
Pivot Charts
Pivot Charts turn the current Pivot result into an interactive analytical view. Pivot includes the renderer-neutral chart lifecycle, a first-party SVG renderer, a searchable chart gallery, semantic drill-down, a current-frame data table, persistence, export, localization, and server-side contracts. No separate charting dependency is required.
PivotChartsPlugin owns chart data, lifecycle, persistence, drill,
synchronization, and rendering. The optional PivotChartsUiPlugin adds the
built-in controls for embedded workspaces, the modeless dialog, and the
Pivot Chart… context-menu action. Applications that only need a chart or
their own controls can install only the headless plugin.
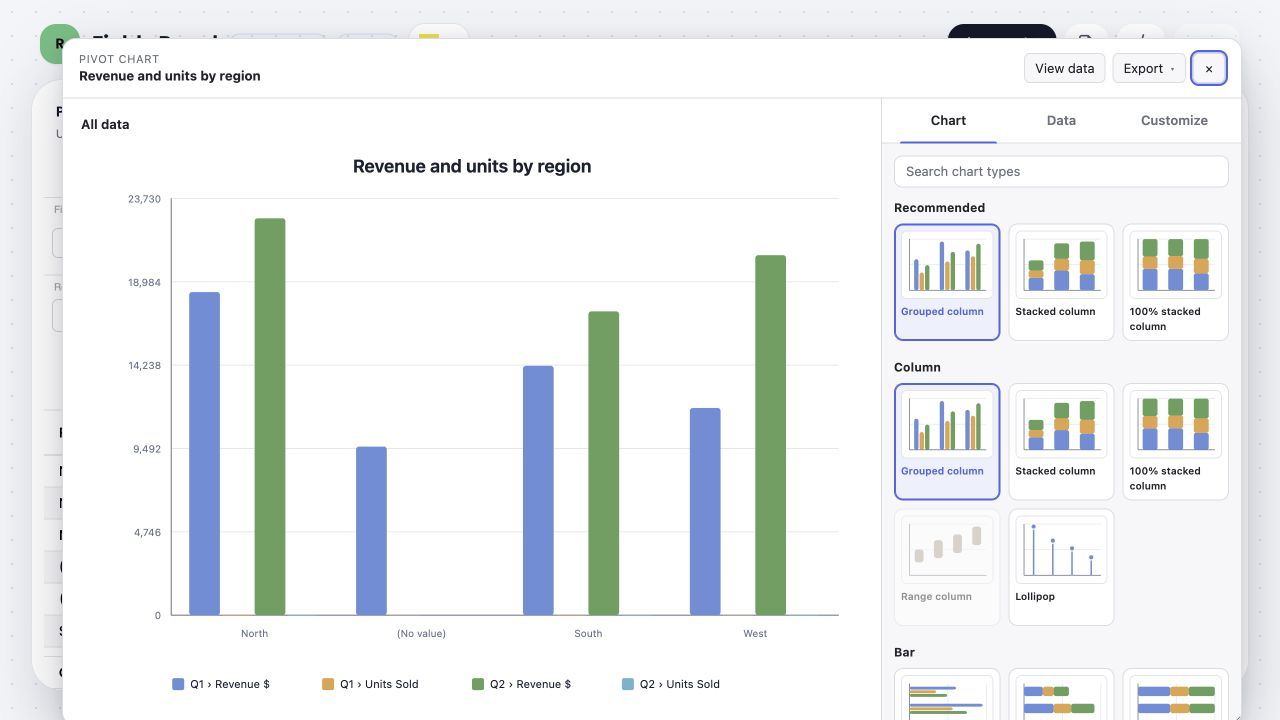
A linked chart keeps the visualization synchronized with the committed Pivot while the modeless dialog remains available for exploration.
Choose a guide
Section titled “Choose a guide”| Guide | What it covers |
|---|---|
| Chart types and compatibility | All 63 built-in types, required data channels, recommendations, and compatibility rules. |
| Data and bindings | Analytical frames, series and channel selection, totals, linking, data view, and limits. |
| Drill-down and interactions | Cell-aware creation, breadcrumbs, synchronization modes, tooltips, legends, keyboard behavior, and events. |
| Customization and export | Presentation, chart options, renderer styling, localization, PNG/PDF, and image encoders. |
| Headless API and persistence | Plugin methods, PivotChartRef, model restore, custom renderers, and lifecycle events. |
| Server data and performance | Complete-data providers, semantic scopes, cancellation, validation, dense data, and geographic capabilities. |
Register Pivot Charts
Section titled “Register Pivot Charts”For a chart-only integration, register the Pivot and headless chart plugins:
import { PivotChartsPlugin, PivotPlugin, createPivotChartsRenderer,} from '@revolist/pivot';
grid.pivotCharts = { renderer: createPivotChartsRenderer(),};grid.plugins = [PivotPlugin, PivotChartsPlugin];grid.pivotCharts is observable. Replacing the configuration updates locale
text and defaults, invalidates cached chart data, and refreshes linked charts.
This is where renderer options, a remote data provider, defaults, limits,
localization, and drill synchronization belong. The application container is
supplied later, when it exists.
Render a chart outside the Pivot grid
Section titled “Render a chart outside the Pivot grid”A Pivot chart does not have to live in a popup or inside <revo-grid>.
mountPivotChart() renders into any application-owned HTMLElement.
| Experience | Plugins | Mount option |
|---|---|---|
| Chart only | PivotPlugin + PivotChartsPlugin | Omit controls |
| Chart with your own controls | PivotPlugin + PivotChartsPlugin | Omit controls, then call chart.update() |
| Chart with built-in controls | Add PivotChartsUiPlugin | controls: 'standard' |
All three render in your container. None creates a popup.
Chart only
Section titled “Chart only”<revo-grid id="pivot"></revo-grid><div id="sales-chart" style="height: 420px"></div>import { PivotChartsPlugin, PivotPlugin, createPivotChartsRenderer, mountPivotChart,} from '@revolist/pivot';
const grid = document.querySelector<HTMLRevoGridElement>('#pivot')!;grid.pivotCharts = { renderer: createPivotChartsRenderer() };grid.plugins = [PivotPlugin, PivotChartsPlugin];
const chart = await mountPivotChart(grid, { container: document.querySelector<HTMLElement>('#sales-chart')!, presentation: { title: 'Sales by region' },});That is the complete integration. The chart defaults to grouped columns and stays linked to the committed Pivot result.
Chart with built-in controls
Section titled “Chart with built-in controls”Add PivotChartsUiPlugin, then request the standard controls at mount time:
import { PivotChartsPlugin, PivotChartsUiPlugin, PivotPlugin, mountPivotChart,} from '@revolist/pivot';
grid.plugins = [PivotPlugin, PivotChartsPlugin, PivotChartsUiPlugin];
const chart = await mountPivotChart(grid, { container: document.querySelector<HTMLElement>('#chart-workspace')!, controls: 'standard',});This embeds the same chart gallery, Data and Customize tabs, drill breadcrumbs, current-frame table, and export actions used by the standard dialog. The application still owns the outer container.
Chart with your own controls
Section titled “Chart with your own controls”Use the chart-only mount and connect only the controls your product needs:
const chart = await mountPivotChart(grid, { container });
typeSelect.addEventListener('change', () => { void chart.update({ chartType: typeSelect.value as PivotChartType, });});Use chart.update() for selected series, bindings, totals, link state,
presentation, theme, or chart-specific options. You do not need the UI plugin
for application-built controls.
Mount after the DOM exists
Section titled “Mount after the DOM exists”The container must exist when mountPivotChart() runs. In Vue, React, and
other component frameworks, mount the chart in the framework’s mounted effect
and destroy it during cleanup.
<script setup lang="ts">import { onBeforeUnmount, onMounted, ref } from 'vue';import { mountPivotChart, type PivotChartRef,} from '@revolist/pivot';
const grid = ref<HTMLRevoGridElement>();const container = ref<HTMLElement>();let chart: PivotChartRef | undefined;let disposed = false;
onMounted(async () => { const mounted = await mountPivotChart(grid.value!, { container: container.value!, }); if (disposed) mounted.destroy(); else chart = mounted;});
onBeforeUnmount(() => { disposed = true; chart?.destroy();});</script>
<template> <revo-grid ref="grid" /> <div ref="container" class="chart" /></template>
<style>.chart { height: 420px; }</style>Use the equivalent mounted effect for React. In an Astro portal, call
mountPivotChart() immediately after the portal target has been appended.
An existing container may start hidden and become visible later: the built-in
renderer uses ResizeObserver and redraws when its size changes. Give it a
non-zero height when visible. Do not place a container, selector, or ref in
grid.pivotCharts or grid.pivotChartsUi.
Open the modeless dialog
Section titled “Open the modeless dialog”PivotChartsUiPlugin.openChart() remains available for an application toolbar
or the Pivot Chart… context-menu action. A grid owns at most one open
dialog, but it may also own any number of embedded charts.
Right-clicking a Pivot analytical cell creates a cell-aware initial scope:
- a group value opens its immediate children;
- a leaf value opens its siblings under the same parent;
- subtotal and grand-total cells choose the nearest valid breakdown;
- the clicked column path and measure become the initial series;
- values-on-rows preserve the clicked row measure.
The scope comes from committed Pivot row and column metadata, not DOM text or a stale grid selection.
What stays synchronized
Section titled “What stays synchronized”Linked charts refresh after committed Pivot changes, filtering, sorting, group expansion, source replacement, and theme changes. Unlinking stores a bounded normalized dataset in the chart model; the snapshot then remains stable until the chart is relinked.
Use the Data tab to choose totals, relationship bindings, drill synchronization, and link state. Use Customize for presentation and chart-specific options. View data switches the plot to the accessible table for the current drill frame without mutating the Pivot or chart model.
Demo and API
Section titled “Demo and API”- Open the live Pivot demo for the complete analytical workspace. The screenshot states in this guide come from the registered Pivot Fields Panel example, which also runs in all four framework wrappers.
- Use the Pivot Charts API reference for exact generated interfaces and signatures.
- Continue with Chart types and compatibility.