
Data and Bindings
Pivot Charts project the committed Pivot result into a renderer-neutral
PivotChartDataset. The standard matrix is efficient for category/series
rendering, while the normalized analytical frame supplies stable fields and
observations for relationship, hierarchy, range, flow, financial, KPI, and
other specialized chart types.
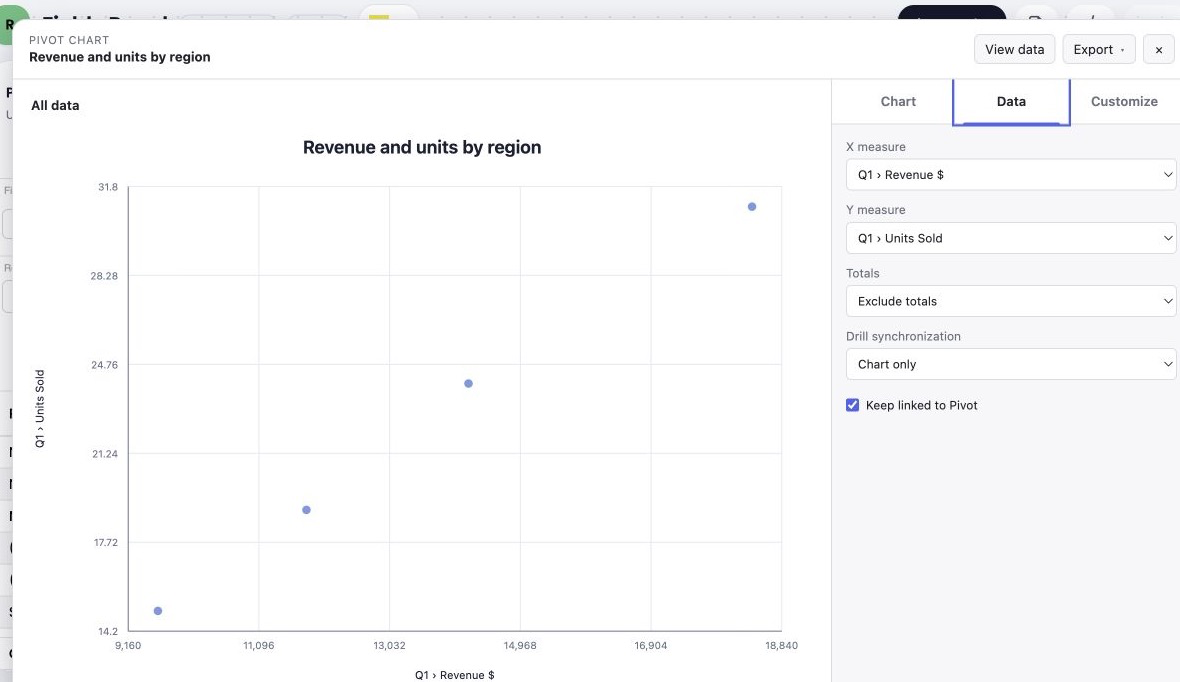
Relationship charts expose required semantic channels directly. The same panel controls totals, drill synchronization, and whether the data remains linked to the Pivot.
Dataset shape
Section titled “Dataset shape”interface PivotChartDataset { revision: number; source: 'client' | 'server'; categories: PivotChartCategory[]; series: PivotChartSeries[]; values: Array<Array<number | null>>; displayValues?: Array<Array<string | null>>; hierarchies?: { row?: PivotChartHierarchyDefinition; column?: PivotChartHierarchyDefinition; }; analyticalFrame?: PivotChartAnalyticalFrame;}values is row-major: values[categoryIndex][seriesIndex]. Optional
displayValues preserve the Pivot’s formatted values for chart labels,
tooltips, data tables, and accessibility text. Categories and series retain
stable IDs, member paths, labels, member kinds, measures, and drill hierarchy
metadata.
The dataset revision identifies the committed Pivot snapshot that produced the frame. Linked refreshes and drill requests use it to reject stale work.
Normalized analytical frame
Section titled “Normalized analytical frame”interface PivotChartAnalyticalFrame { fields: PivotChartFieldDescriptor[]; observations: PivotChartObservation[]; hierarchies?: PivotChartDataset['hierarchies']; derived?: { bins?: PivotChartJsonValue[]; quantiles?: PivotChartJsonValue[]; ranges?: PivotChartJsonValue[]; flowEdges?: PivotChartJsonValue[]; financial?: PivotChartJsonValue[]; geographicFeatures?: PivotChartJsonValue[]; };}Fields declare a stable ID, label, dimension/measure role, semantic type, source field, aggregator, and optional format. Each observation stores dimension values separately from numeric measures and optional display measures. Specialized renderers consume the normalized fields and derived views instead of guessing meaning from a series label.
Semantic bindings
Section titled “Semantic bindings”PivotChartBindings assigns stable field IDs to renderer channels. Empty and
omitted channels are equivalent.
| Channel group | Channels | Used by |
|---|---|---|
| Standard matrix | category, series, value | Column, bar, line, area, part-to-whole, matrix, and combination types. |
| Relationship | x, y, size, color, shape | Scatter, bubble, density, and connected-scatter views. |
| Polar | angle, radius | Polar and radial layouts. |
| Hierarchy | hierarchy, parent, child, weight | Treemap, sunburst, icicle, and circle packing. |
| Flow | source, target, weight | Sankey and chord. |
| Range | start, end, low, high | Timeline, range, confidence, and error views. |
| Financial | open, high, low, close, volume | Candlestick, OHLC, and volume-price. |
| KPI | actual, target, variance | Bullet, gauge, KPI, and progress gauge. |
| Faceting and text | facetRow, facetColumn, label, tooltip | Small multiples and supplemental labels/tooltips. |
The chart gallery checks required channel counts before selection. For relationship charts, the Data panel infers distinct X/Y measures when possible and prevents the same field from satisfying both required channels.
await chart.update({ chartType: 'bubble', bindings: { x: ['measure:cost:sum'], y: ['measure:revenue:sum'], size: ['measure:units:sum'], },});Use field IDs from dataset.analyticalFrame.fields, not visible labels.
Series and values-on-rows
Section titled “Series and values-on-rows”seriesIds selects a subset of dataset series. Types whose catalog definition
uses firstAvailable select one series even when the Pivot exposes several.
Types marked all retain the compatible series selection.
When the Pivot places values on rows, the category carries its measure.
categoryMeasure selects the required { prop, aggregator } pair without
rewriting row paths or pretending the measure is a column series.
const dataset = await charts.getChartData({ chartType: 'line', seriesIds: ['series:2026'], categoryMeasure: { prop: 'revenue', aggregator: 'sum', },});Totals
Section titled “Totals”totals accepts four modes:
| Mode | Included members |
|---|---|
none | Leaf and group members only. |
grand | Include grand totals. |
subtotals | Include subtotals. |
all | Include grand totals and subtotals. |
The default is none. Totals keep their semantic member kind, so charts,
tooltips, data tables, drill logic, and persisted models can distinguish them
from ordinary categories.
Linked and unlinked data
Section titled “Linked and unlinked data”A linked chart follows the current committed Pivot. Data, filters, sorting, group expansion, source, Pivot model, and relevant theme changes schedule coalesced refreshes.
Turning off Keep linked to Pivot stores the current bounded normalized
dataset in model.dataset. Later Pivot changes do not affect that chart.
Relinking removes the stored snapshot and projects the latest committed Pivot
state. Restore validates both linked models and embedded unlinked datasets.
Current-frame data table
Section titled “Current-frame data table”The header’s View data action replaces the plot with a sortable accessible table for the active drill frame. It:
- uses the same category order, series, and formatted display values as the chart;
- represents missing observations consistently;
- announces sort changes and exposes semantic table headers;
- does not alter the chart model, link state, Pivot, or drill state;
- switches back through View chart.
Scope and limits
Section titled “Scope and limits”getChartData can request the immediate children of a semantic parent:
const dataset = await charts.getChartData({ chartType: 'groupedColumn', totals: 'none', scope: { rowPath: ['Europe'], columnPath: [2026], },});Default safety limits are 1,000 categories, 250 series, and 50,000 data points.
The plugin validates limits, actual counts, matrix dimensions, observations,
bindings, and chart compatibility. Unsafe projections fail with a
PivotChartError rather than silently changing persisted data.
Previous: Chart types and compatibility · Next: Drill-down and interactions · API reference